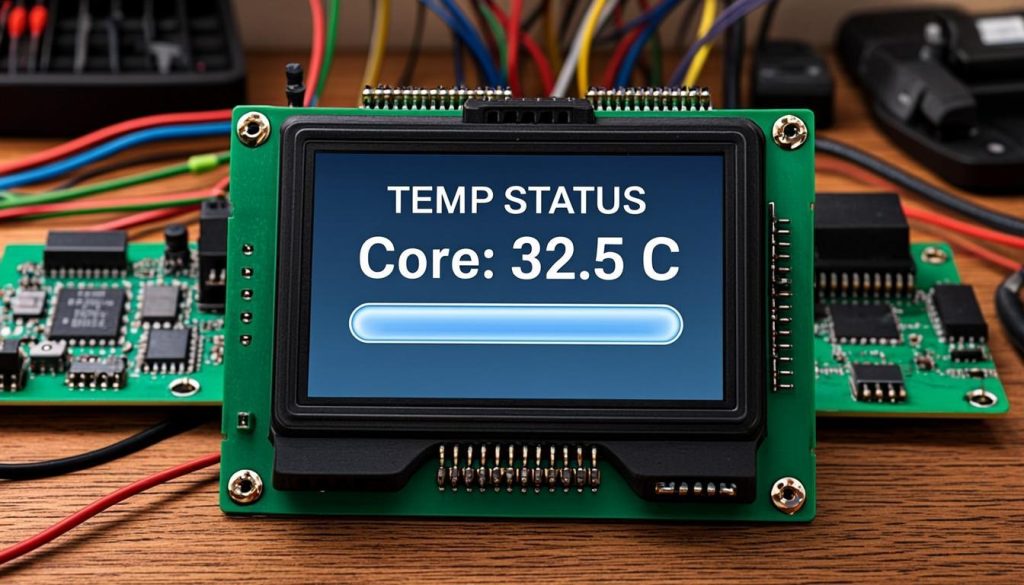
Building a professional embedded user interface doesn’t require an expensive color TFT. In this guide, you will learn how to use the U8g2 graphics library to craft a sleek, responsive dashboard with dynamic data and progress bars on a classic 128×64 monochrome display.
In this guide, we shall cover the following:
- Introduction.
- Building the UI.
- Results.
1. Introduction:
In the modern era of embedded systems, it is easy to assume that every project requires a vibrant, full-color TFT touchscreen to look professional. We are surrounded by smartphones, tablets, and sleek consumer electronics that set a high bar for visual fidelity, and that expectation often bleeds into our microcontroller projects. However, reaching for a color display the moment you need to display a few metrics often leads to unnecessary complications: inflated Bill of Materials (BOM) costs, complex SPI or parallel drivers, higher power consumption, and sometimes sluggish refresh rates that ruin the user experience.
The truth is, you rarely need 65,000 colors to display temperature, CPU load, or system status. A classic, $3 monochrome 128×64 graphical LCD (GLCD) or OLED screen is more than capable of delivering a sleek, high-tech user interface—provided you pair it with the right software tools and a bit of design discipline. Monochrome displays offer incredible contrast, excellent sunlight readability, and rock-solid reliability, making them a staple in industrial equipment, benchtop tools, and compact IoT devices. The secret to making them look modern isn’t adding color; it’s adding structure, typography, and dynamic elements.
This is where U8g2 comes in. As the premier monochrome graphics library for embedded C and C++, U8g2 takes the pain out of driving raw pixels. It handles the complex timing and initialization of hundreds of different displays and provides a powerful graphics engine that supports lines, boxes, circles, and most importantly, an absolutely massive library of scalable, professional fonts. With U8g2, the limitations of 1-bit graphics disappear, replaced by the ability to draw inverse text, sleek data layouts, and custom widgets.
In this guide, we are going to prove that constraints breed creativity. We will walk step-by-step through building a live “System Status” dashboard from scratch using an STM32 and a standard 128×64 display. Moving past the basic “Hello World” text, we will construct a UI that features a bold header, mixed typography for visual hierarchy, live string formatting, and a dynamic progress bar that smoothly sweeps across the screen using simulated sensor data.
Whether you are building a custom mechanical keyboard, a 3D printer controller, or a compact sensor node, the principles in this guide will change the way you approach monochrome UI design. Let’s dive in and build something that looks so good, no one will believe it’s running on a 1-bit display.
2. UI Development:
We shall continue from this guide here.
In main.c, in user code begin PV, declare the following simulated variable of the UI:
// --- UI and Simulation Variables ---
static float sim_temp = 25.0f;
static float sim_cpu = 50.0f;
static uint8_t sim_load = 50;
static uint32_t start_tick = 0;
Next, in user code begin 0, declare a function that will draw the horizontal progress bar as follows:
// Helper function to draw a horizontal progress bar
void draw_progress_bar(uint8_t x, uint8_t y, uint8_t w, uint8_t h, uint8_t percentage) {
    // 1. Draw the outer border
    u8g2_DrawFrame(&myDisplay, x, y, w, h);

    // 2. Calculate fill width based on percentage
    uint8_t fill_w = (uint8_t)((w - 2) * percentage / 100.0f);

    // 3. Draw the solid fill inside the border
    if (fill_w > 0) {
        u8g2_DrawBox(&myDisplay, x + 1, y + 1, fill_w, h - 2);
    }
}
We start by drawing the frame, which is the box of the progress bar.
Next, determine how much to fill the progress bar from the percentage value.
Finally, fill the progress bar with box value.
Next, a function to render the UI:
// The main UI rendering function
void render_ui(void) {
    // 1. Gather data
    uint32_t uptime = (HAL_GetTick() - start_tick) / 1000; // Seconds since boot

    // 2. Format data into strings
    char temp_str[20];
    char cpu_str[20];
    char time_str[20];
    char load_str[20];

    // Convert seconds to HH:MM:SS
    uint32_t h = uptime / 3600;
    uint32_t m = (uptime % 3600) / 60;
    uint32_t s = uptime % 60;

    snprintf(temp_str, sizeof(temp_str), "Core:  %.1f C", sim_temp);
    snprintf(cpu_str, sizeof(cpu_str), "CPU:   %.1f %%", sim_cpu);
    snprintf(time_str, sizeof(time_str), "Time:  %02d:%02d:%02d", h, m, s);
    snprintf(load_str, sizeof(load_str), "%d%%", sim_load);

    // 3. Clear the internal buffer
    u8g2_ClearBuffer(&myDisplay);

    // 4. Draw the Header (Using a bold font)
    u8g2_SetFont(&myDisplay, u8g2_font_6x13B_tr);
    u8g2_DrawStr(&myDisplay, 0, 10, "TEMP STATUS");
    u8g2_DrawHLine(&myDisplay, 0, 13, 128); // Underline the header

    // 5. Draw the Text Data (Using a standard font)
    u8g2_SetFont(&myDisplay, u8g2_font_6x10_tr);
    u8g2_DrawStr(&myDisplay, 0, 28, temp_str);
    u8g2_DrawStr(&myDisplay, 0, 42, cpu_str);
    u8g2_DrawStr(&myDisplay, 0, 54, time_str);

    // 6. Draw the Progress Bar
    u8g2_SetFont(&myDisplay, u8g2_font_5x7_tr);
    u8g2_DrawStr(&myDisplay, 0, 63, "LOAD");
    draw_progress_bar(25, 56, 85, 7, sim_load);

    // Draw percentage text at the end of the bar
    u8g2_DrawStr(&myDisplay, 112, 63, load_str);

    // 7. Send the buffer to the screen
    u8g2_SendBuffer(&myDisplay);
}
We start by calculating the time since the MCU booted in seconds and convert it into time in hours, minutes and seconds.
fill the buffer for the time, temperature, load and CPU.
Clear the buffer and start filling it with the required data and send it to the display.
In use code begin 2 in main function:
u8g2_InitDisplay(&myDisplay);
u8g2_SetPowerSave(&myDisplay, 0);
u8g2_ClearBuffer(&myDisplay);

// Record start time
start_tick = HAL_GetTick();

uint32_t last_update = 0;
float time_counter = 0.0f; // Used for sine wave simulation
Initialize the display, wake it up and clear the buffer.
Get the current ticks which is in ms.
Declare some local variables to update the UI.
In user code begin 3 in while 1 loop:
Get the current ticks:
uint32_t now = HAL_GetTick();
If the difference is more than 50 ms:
if (now - last_update > 50) {Store the now value into last_update as follows:
last_update = now;
Increment the timer counter by 0.05, which is equivalent to 50mS.
// Increment time counter (0.05f matches the 50ms interval)
time_counter += 0.05f;
Next, simulate the changes:
 // --- Simulate Data Changing ---

// Temperature oscillates smoothly between 20.0 and 45.0 C
// sin(x) returns -1 to 1. We scale it to 0 to 1, then multiply by 25, and add 20.
sim_temp = 20.0f + ((sinf(time_counter * 0.5f) + 1.0f) / 2.0f) * 25.0f;

// CPU oscillates smoothly between 10% and 90%
sim_cpu = 10.0f + ((sinf(time_counter * 0.8f + 1.0f) + 1.0f) / 2.0f) * 80.0f;

// Load increments and decrements based on CPU
// Use a sine wave for smooth 0-100% sweeping
sim_load = (uint8_t)(((sinf(time_counter * 0.4f) + 1.0f) / 2.0f) * 100.0f);
Finally, render the UI:
// --- Render the UI ---
render_ui();
Thats all for the guide.
Save, build the project and run it as follows:

You may download the source code from here.
3. Results:
You should get the following on your GLCD12864:
Stay tuned.
Happy coding 😉

Add Comment